What Can Uber Eats and DoorDash Data Insights Tell About 65% Trending Menu Choices?

Introduction
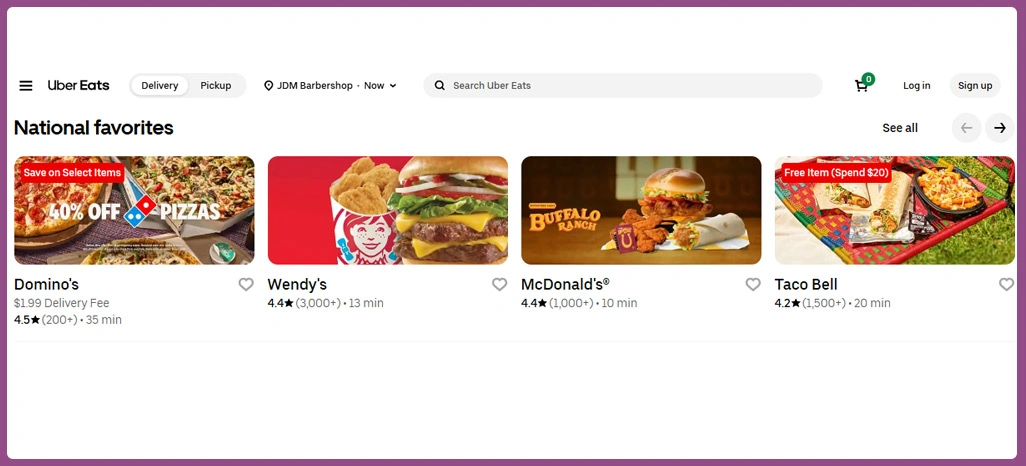
As the online food delivery market continues to reshape dining behavior, data-backed insights have become crucial in understanding customer preferences and predicting menu trends. Platforms like Uber Eats and DoorDash generate vast datasets that reflect consumer choices, pricing variations, and rating behaviors across regions. These insights are not only transforming how restaurants design menus but also helping them analyze what drives recurring orders and customer satisfaction.
Through Uber Eats and DoorDash Data Insights, food businesses can determine the exact combination of taste, convenience, and value that appeals to modern consumers. Data from delivery platforms reveals that over 65% of trending menu items belong to comfort food categories such as burgers, pizzas, and Asian fusion dishes — signaling a strong preference for familiarity mixed with regional flair.
With the help of Food Data Scraping, analysts can collect structured data on top-performing menu items, delivery time patterns, and pricing behavior. This intelligence helps in predicting future food delivery movements, supporting strategic decisions for restaurants and cloud kitchens aiming to optimize their digital performance and appeal to a broader audience across the USA.
Key Factors Influencing Menu Item Popularity
Gaining clarity on why certain food items dominate delivery charts requires a comprehensive view of consumer choices, menu pricing, and regional taste preferences. Through consistent Uber Eats Menu Data Analysis, restaurants can assess which dishes attract recurring customers and what influences their decision to reorder.
The connection between pricing, quality, and convenience is increasingly evident. Food outlets that maintain affordability while ensuring product consistency experience superior performance metrics. Studies reveal that eateries focusing on moderate pricing structures achieve better user ratings compared to those emphasizing exclusivity or premium offerings.
Evaluating engagement data also highlights behavioral patterns based on cuisine type, order timing, and repeat frequency. When combined with additional insights from Restaurant Rating Data Analysis, brands can enhance their marketing decisions and adjust their offerings according to the demographics of their target market. Such analysis provides long-term benefits by optimizing menu placements and improving digital discoverability.
| Factor | Impact on Popularity | Average Growth |
|---|---|---|
| Local Cuisine Offerings | High engagement in metro cities | +38% |
| Affordable Menu Pricing | Higher conversion rate | +27% |
| Consistent Delivery Timing | Improved ratings | +31% |
| New Menu Item Rotation | Enhanced retention | +24% |
By blending structured data interpretation and market-specific strategy, restaurants can align their product portfolios with user expectations, enhancing both performance and retention.
Relationship Between Ratings, Prices, and Customer Value
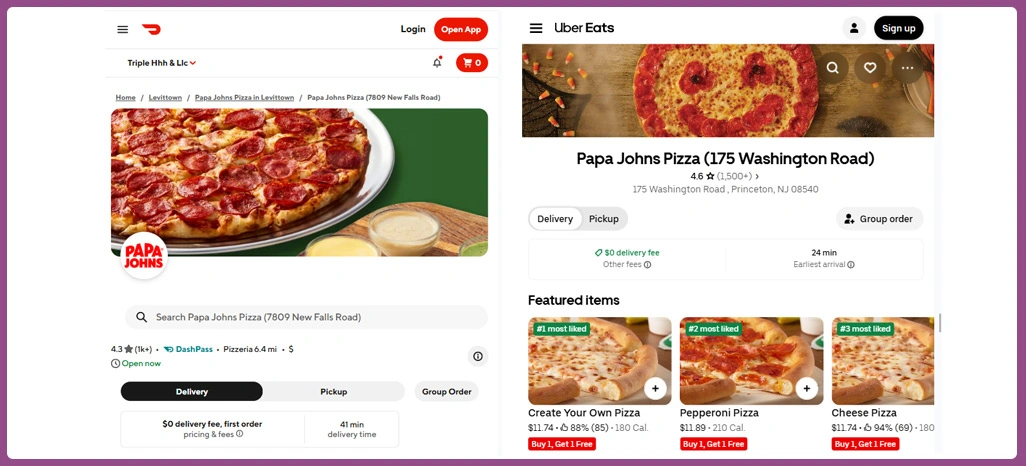
An effective restaurant performance strategy depends on understanding the interplay between menu pricing and customer satisfaction. Using DoorDash Food Delivery Dataset insights, food brands can measure how small adjustments in pricing influence both ratings and retention. The majority of restaurants maintaining consistent mid-range prices record higher loyalty scores and stronger sales conversion ratios.
With DoorDash Restaurant Rating Trends becoming a vital benchmark, many operators analyze pricing transparency, quality consistency, and delivery speed to determine their competitive standing. In urban centers like Los Angeles and New York, price accuracy combined with clear product descriptions has shown a direct link to increased consumer trust and a notable rise in average order value.
The process of Restaurant Rating Data Analysis allows businesses to identify which menu attributes most impact review quality. Restaurants that regularly update their product descriptions, maintain ingredient transparency, and respond promptly to feedback often receive superior customer engagement results. This proactive approach also supports improved visibility on delivery apps through consistent positive sentiment scores.
| Rating Bracket | Average Price (USD) | Repeat Order Rate |
|---|---|---|
| 4.5 – 5.0 | 14.8 | 69% |
| 4.0 – 4.4 | 12.6 | 52% |
| 3.5 – 3.9 | 10.4 | 37% |
| Below 3.5 | 9.1 | 24% |
Restaurants applying these data-driven insights can optimize both value perception and operational excellence, fostering higher retention and positive digital reputation growth.
Consumer Behavior Insights Through Dataset Comparisons
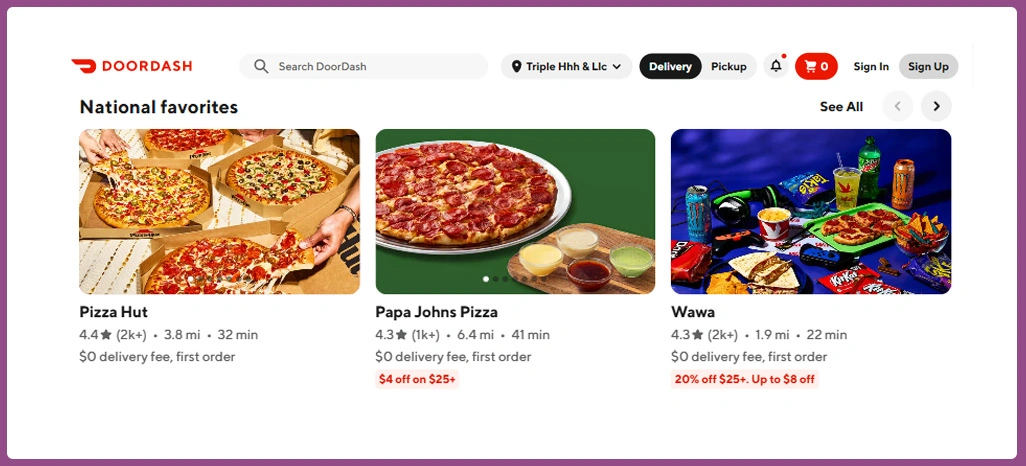
Understanding order behavior across multiple delivery systems requires structured analytics drawn from Uber Eats Food Delivery Datasets. This information helps in distinguishing how location, cuisine type, and timing influence purchase preferences. Reports indicate that Asian and Mexican cuisines collectively account for nearly half of all delivery orders, particularly in high-density metropolitan areas.
When combined with DoorDash Menu Price Tracking, this data reveals an interesting trend — cities with stable pricing across delivery platforms witness higher retention levels and stronger repeat order growth. Such uniformity builds confidence among users who prefer predictable costs over fluctuating price points.
Tracking engagement levels by cuisine also offers valuable insights into customer expectations. Time-based analytics demonstrate that Asian and Italian cuisines reach peak ordering windows in the evening, while American fast-casual options dominate lunchtime orders. This knowledge assists restaurant managers in adjusting menu listings and promotions to better align with demand cycles.
| Cuisine Type | Average Order Share | Peak Ordering Time |
|---|---|---|
| Asian | 24% | 7 PM – 10 PM |
| Mexican | 19% | 6 PM – 9 PM |
| American | 17% | 11 AM – 2 PM |
| Italian | 15% | 7 PM – 9 PM |
By combining comparative platform data with behavioral analytics, brands can refine their content, pricing, and delivery operations to build a more data-informed restaurant ecosystem.
Real-Time Tracking for Enhanced Delivery Operations
Continuous monitoring of restaurant performance metrics enables quicker decision-making and reduces operational inefficiencies. Integrating Food Delivery Data Intelligence allows businesses to observe live order flows, analyze rating movements, and measure customer satisfaction at every stage of the delivery process. These insights help pinpoint service gaps before they impact user perception.
Predictive analytics based on Food Delivery Trend Analysis 2025 show that restaurants capable of adjusting to real-time trends report 33% fewer negative reviews. Implementing dynamic operational dashboards provides restaurant teams with up-to-the-minute alerts on delivery issues, late arrivals, and rating drops, ensuring proactive management.
Data gathered from monitoring dashboards can further support forecasting seasonal surges, event-based spikes, and special promotion periods. The more effectively restaurants analyze live metrics, the better they can balance order loads and maintain timely service. This approach results in improved ratings, reduced customer complaints, and better order-to-delivery time synchronization.
| Monitoring Parameter | Operational Benefit | Success Rate |
|---|---|---|
| Real-Time Rating Analysis | Immediate response capability | +35% |
| Menu Performance Tracking | Higher item visibility | +28% |
| Delivery Speed Optimization | Improved satisfaction | +40% |
| Predictive Demand Forecasting | Reduced downtime | +25% |
Adopting a structured real-time framework ensures restaurants are well-positioned to respond to sudden market changes, ensuring service reliability and consistent customer experiences.
Using Automation and Design to Improve Engagement
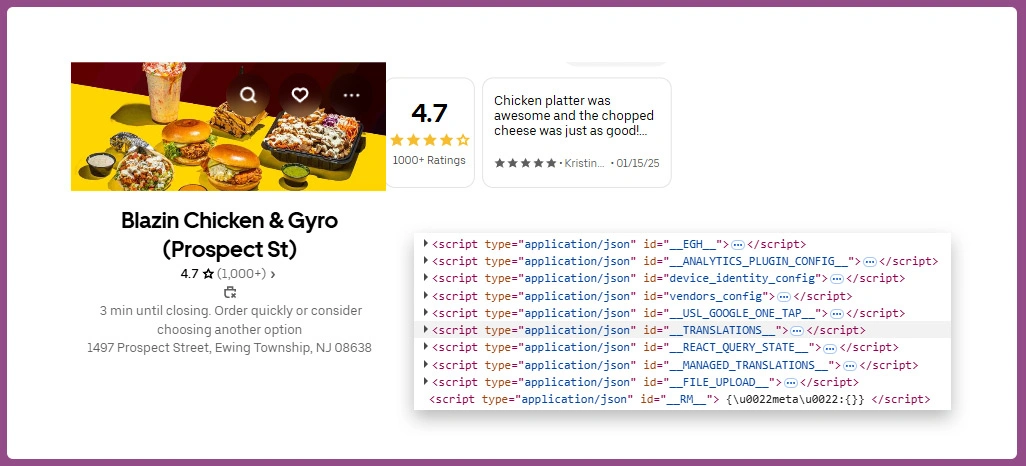
Automation has become a transformative element in restaurant digitalization. Utilizing a Food Scraping API helps restaurants collect structured data about competitors, menu pricing, and consumer reviews more efficiently. This automation minimizes manual intervention and allows for instant updates to menu designs and listings.
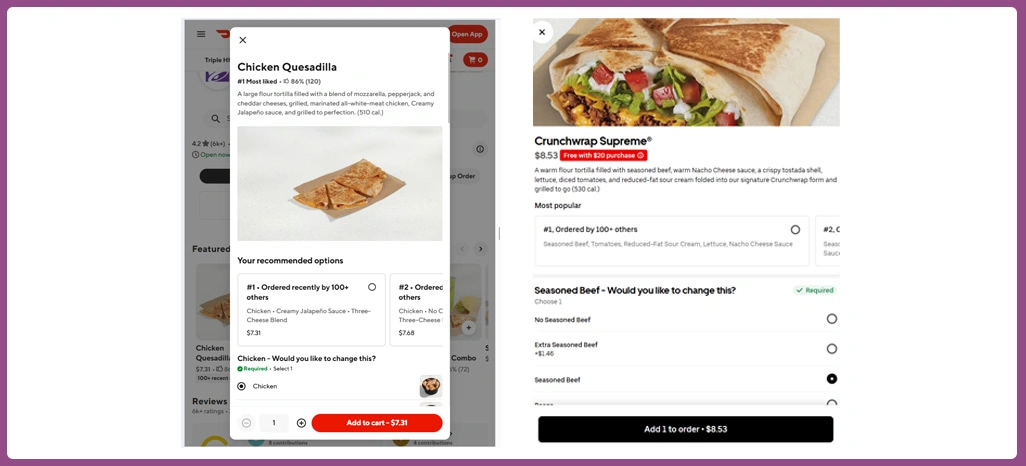
By combining technology with strategic Menu and Customer Review Scraping, businesses gain actionable insights into how descriptions, visuals, and item positioning affect purchasing decisions. Restaurants implementing these insights experience stronger engagement, particularly when enhancing their product pages with appealing visuals and transparent pricing.
Behavioral findings from Online Food Ordering Behavior USA show that customers value both the aesthetics and clarity of menu listings. When images are combined with precise information such as ingredients and nutritional value, conversion rates rise dramatically. Digital presentation has thus become a core factor in retaining user attention and motivating purchases.
| Feature Element | Conversion Increase | User Engagement |
|---|---|---|
| High-quality Images | +29% | +33% |
| Detailed Descriptions | +22% | +28% |
| Transparent Pricing | +17% | +19% |
| Customer Reviews Integration | +31% | +26% |
As automation and user-focused design merge, restaurants can enhance digital engagement, promote consistent updates, and sustain their market relevance through continual interface improvement.
Comparing Platform Insights and Market Direction Shifts
The competition between major food delivery platforms continues to shape the direction of digital dining. According to Uber Eats vs DoorDash Market Trends, both services are experiencing unique strengths within different market segments. DoorDash maintains dominance in suburban regions due to extensive partner networks, while Uber Eats thrives in metropolitan areas offering premium dining selections.
Ongoing Real-Time Food Delivery Data Monitoring allows restaurants to measure platform-specific performance and identify which listings perform best by region, cuisine, and time slot. These insights are essential for refining strategy, especially when optimizing delivery speed, menu layout, or pricing.
Data comparison also reveals a trend toward regional menu adaptation. Suburban areas favor traditional comfort foods, while cities showcase increasing interest in fusion and global cuisines. Tracking customer preferences across these segments assists restaurant managers in tailoring promotional offers and item placements.
| Platform | Market Share | Customer Retention | Top Cuisine |
|---|---|---|---|
| Uber Eats | 52% | 71% | Asian |
| DoorDash | 48% | 67% | American |
The integration of performance tracking tools with market-specific data enables businesses to make smarter operational decisions, ensuring they can adapt swiftly to evolving consumer expectations and emerging digital dining opportunities.
How Retail Scrape Can Help You?
For businesses seeking to extract accurate and timely information, Uber Eats and DoorDash Data Insights can be enhanced using our specialized data extraction capabilities. The platform provides structured, scalable, and reliable delivery analytics solutions for restaurants, aggregators, and analytics firms.
We offers:
- End-to-end data collection from multiple food delivery platforms.
- Automated menu updates with real-time data feeds.
- Comparative pricing and rating analytics.
- Scalable solutions customized per region or cuisine type.
- Continuous performance monitoring and anomaly detection.
- Secure integration for analytics platforms and dashboards.
We ensure every dataset is optimized for usability, accuracy, and operational efficiency. By integrating Restaurant Rating Data Analysis, businesses can uncover actionable insights to enhance customer satisfaction and strengthen their market position.
Conclusion
Understanding the evolving consumer landscape through Uber Eats and DoorDash Data Insights allows food businesses to refine their strategies, create impactful menus, and foster loyalty across digital delivery channels. Data-driven decision-making transforms ordinary restaurant operations into performance-oriented systems that adapt quickly to market shifts.
As the demand for seamless delivery experiences grows, advanced analytics such as Food Delivery Trend Analysis 2025 provide restaurants with the predictive clarity needed to stay competitive. To begin your journey toward data-empowered food intelligence, connect with Retail Scrape today to turn insights into smarter menu success.